इलेक्ट्रॉनिकी और सूचना प्रौद्योगिकी मंत्रालय, भारत सरकार
MINISTRY OF
ELECTRONICS AND INFORMATION TECHNOLOGY, GOVERNMENT OF INDIA
इलेक्ट्रॉनिकी और सूचना प्रौद्योगिकी मंत्रालय, भारत सरकार
MINISTRY OF
ELECTRONICS AND INFORMATION TECHNOLOGY, GOVERNMENT OF INDIA
The Governments shift towards digitalization through initiatives like ‘Digital India’ has resulted in a drastic increase in data. The powerful analytics tool is required to analyse the collective data that enables governments with better strategy and data-driven decision-making to predict trends in needs and measure programme success.
Tejas is an easy, powerful, and affordable analytics visualization tool developed through the collaborative effort of NIC and NICSI (CEDA) under the guidance of the Ministry of Electronics and Information Technology (MeitY). It is a complete data preparation and analytics platform with the power to integrate all data types. This tool is completely developed in-house using open source technologies and brings together the best features comparable to those of market-leading BI tools.
Tejas provides state-of-the-art and powerful data analysis for officials to design analytical reports and turns data into accurate analysis and smart visualizations. The tool would be primarily used by government departments at various levels in the centre and state. Only a basic knowledge of data analysis and reporting is expected from government employees, and they are not expected to be very familiar with data visualization and business intelligence tools as the user interface is simple, easy to use, and self-explanatory.

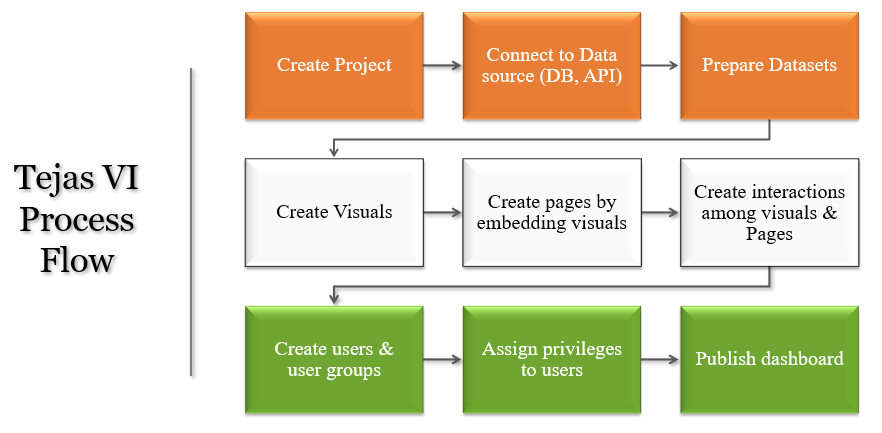
Tejas can be connected virtually to any data source, blend and prepare that data in a drag-and-drop environment, and create clean datasets for further exploration and analysis. It can build scalable workflows, automate processes, share reports, improve efficiency, and make an impact, without any coding. Departments can expose their data through a web-based API or directly upload flat files into the tool. Tejas would be provided on a Software as a Service (SaaS) model to various government departments, thus there would be no need to purchase and host any other BI tool.
Tejas empowers discussions on displayed information through comments, allows officials to download visuals and data with associated notes, enables sharing of visuals over NIC mail, GIMS, and other social media, and empowers analysis by creating personalized views for different officials with minimum repetition of effort. It enables officials to understand the quality of the data being captured, the top performers on a key performance indicator (KPI), create scorecards to track performance on a group of related KPIs, the root causes driving the value of a KPI, segments that need most attention for improvement, and look at the data in different ways, such as by time series, relative ranks, parts of a whole, etc.
For more details please visit our Tejas Website.
Registered Cloud users may Click here and submit their Service Request (SR) to avail the above service, whereas new users ( i.e., users not yet registered for cloud ) are requested to first apply for the Cloud Registration with reference to the On-boarding procedure.
Please describe the problem you are trying to solve. The experts at NIC Cloud will help you find the right solution.